|
200
|
Disables the control
with thisform.Graph1
.BeginUpdate
.AutoFit = .T.
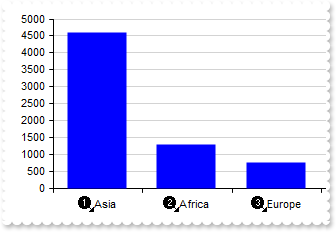
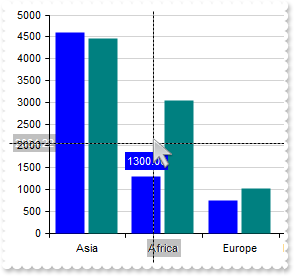
var_s = "<img>1</img>Asia(4600),<img>2</img>Africa(1300),<img>3</img>Europe(747),<img>4</img>North America(579),<img>5</img>South America"
var_s = var_s + "(433),<img>6</img>Australia/Oceania(42)"
.Series.Add(var_s)
.Enabled = .F.
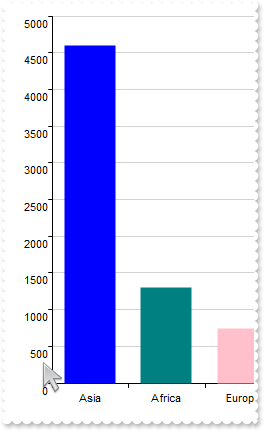
.Legend.Visible = .T.
.EndUpdate
endwith
|
|
199
|
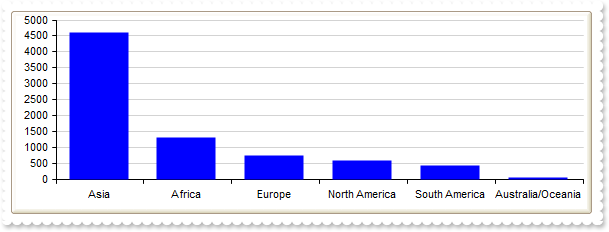
Show icons
with thisform.Graph1
	.BeginUpdate
	var_s = "gBJJgBAIDAAGAAEAAQhYAf8Pf4hh0QihCJo2AEZjQAjEZFEaIEaEEaAIAkcbk0olUrlktl0vmExmUzmk1m03nE5nU7nk9n0/oFBoVDolFo1HpFJpVLplNp1PqFRqVTql"
	var_s = var_s + "Vq1XrFZrVbrldr1fsFhsVjslls1ntFptVrtltt1vuFxuVzul1u13vF5vV7vl9v1/wGBwWDwmFw2HxGJxWLxmNx0xiFdyOTh8Tf9ZymXx+QytcyNgz8r0OblWjyWds+m0"
	var_s = var_s + "ka1Vf1ta1+r1mos2xrG2xeZ0+a0W0qOx3GO4NV3WeyvD2XJ5XL5nN51aiw+lfSj0gkUkAEllHanHI5j/cHg8EZf7w8vl8j4f/qfEZeB09/vjLAB30+kZQAP/P5/H6/yN"
	var_s = var_s + "AOAEAwCjMBwFAEDwJBMDwLBYAP2/8Hv8/gAGAD8LQs9w/nhDY/oygIA="
	.Images(var_s)
	.AutoFit = .T.
	var_s1 = "<img>1</img>Asia(4600),<img>2</img>Africa(1300),<img>3</img>Europe(747),<img>4</img>North America(579),<img>5</img>South America"
	var_s1 = var_s1 + "(433),<img>6</img>Australia/Oceania(42)"
	.Series.Add(var_s1)
	.SeriesColors = "blue"
	.EndUpdate
endwith
|
|
198
|
Displays the control's version
with thisform.Graph1
	DEBUGOUT( .Version )
endwith
|
|
197
|
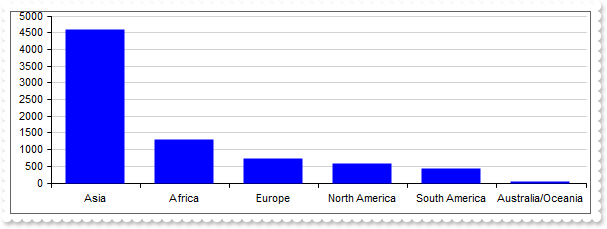
Changes the control's border (EBN)
with thisform.Graph1
	.BeginUpdate
	.AutoFit = .T.
	.VisualAppearance.Add(1,"c:\exontrol\images\normal.ebn")
	.Appearance = 16777216 && 0x1000000
	.Series.Add("Asia(4600),Africa(1300),Europe(747),North America(579),South America(433),Australia/Oceania(42)")
	.SeriesColors = "blue"
	.EndUpdate
endwith
|
|
196
|
Changes the control's border
with thisform.Graph1
	.BeginUpdate
	.AutoFit = .T.
	.Appearance = 1
	.Series.Add("Asia(4600),Africa(1300),Europe(747),North America(579),South America(433),Australia/Oceania(42)")
	.SeriesColors = "blue"
	.EndUpdate
endwith
|
|
195
|
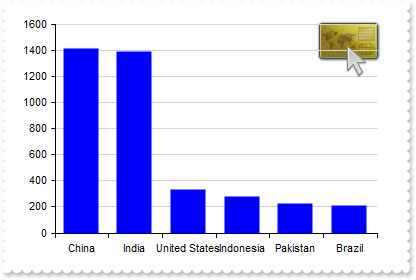
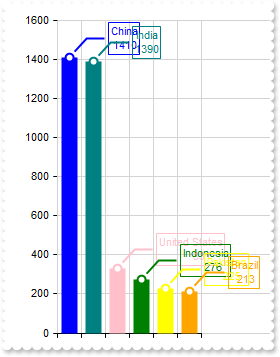
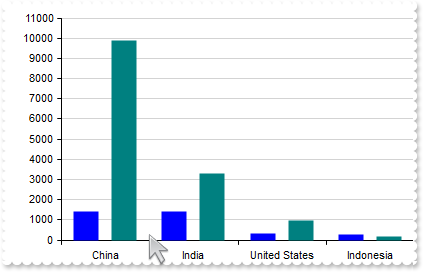
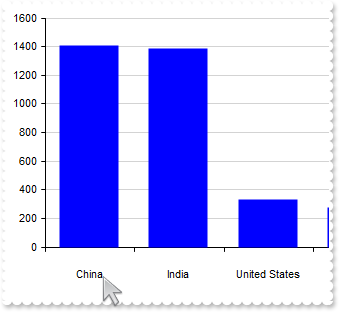
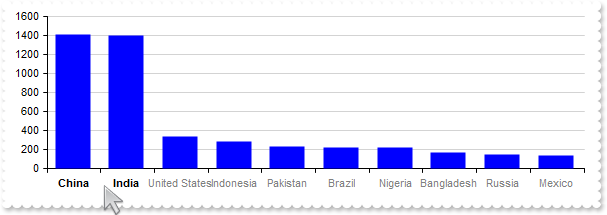
Display the logo on the control's background
with thisform.Graph1
	.BeginUpdate
	.Picture = thisform.Graph1.ExecuteTemplate("loadpicture(`c:\exontrol\images\card.png`)")
	.PictureDisplay = 2
	.AutoFit = .T.
	.CategoryAxis.Categories = "China,India,United States,Indonesia,Pakistan,Brazil"
	.Series.Add("1410,1390,331,276,225,213")
	.SeriesColors = "blue"
	.EndUpdate
endwith
|
|
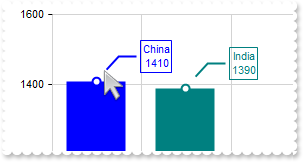
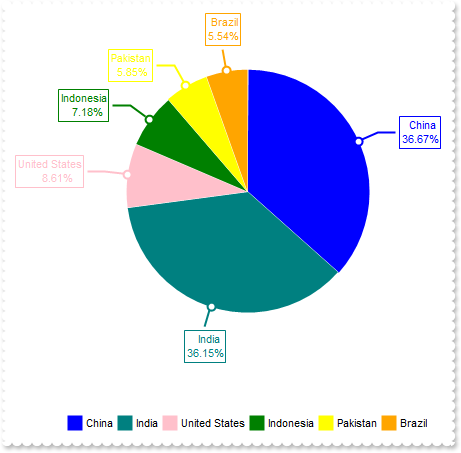
194
|
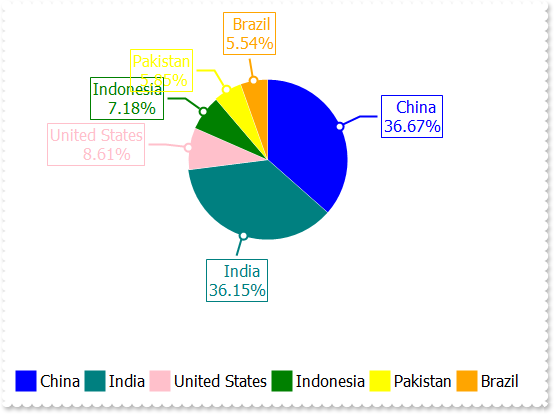
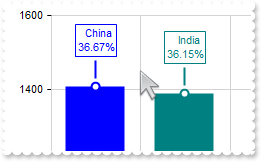
Changes the control's font
with thisform.Graph1
.BeginUpdate
with .Font
.Name = "Tahoma"
.Size = 12
endwith
with .CategoryAxis
.Categories = "China,India,United States,Indonesia,Pakistan,Brazil"
.MajorGridLines.Color = "lightgray"
endwith
with .Series.Add("1410,1390,331,276,225,213")
.Type = "Pie"
.ShowValue = 7 && ShowValueEnum.exValue Or ShowValueEnum.exLine Or ShowValueEnum.exPoint
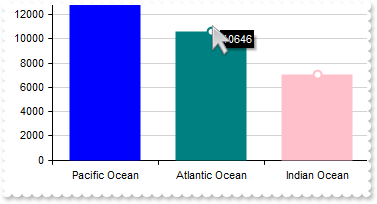
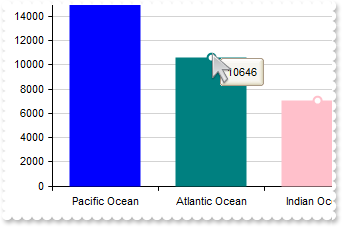
.ValueFormat = "`<c>` + category + `<br><c>` + (percent format ``) + `%`"
endwith
.Legend.Visible = .T.
.EndUpdate
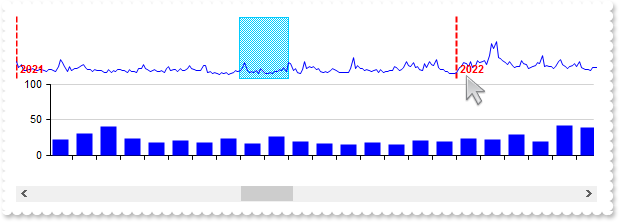
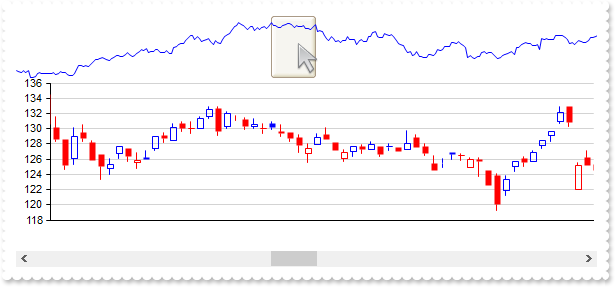
endwith
|
|
193
|
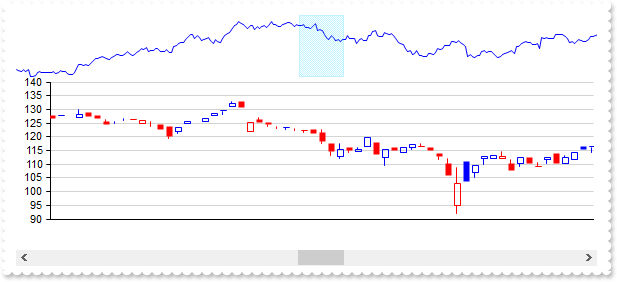
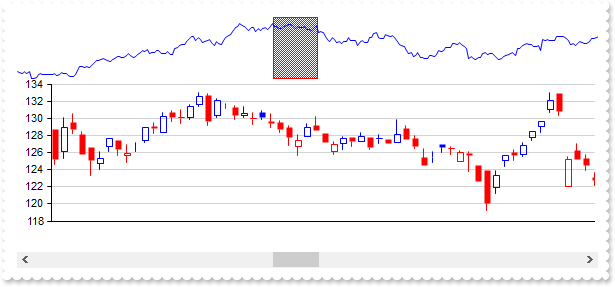
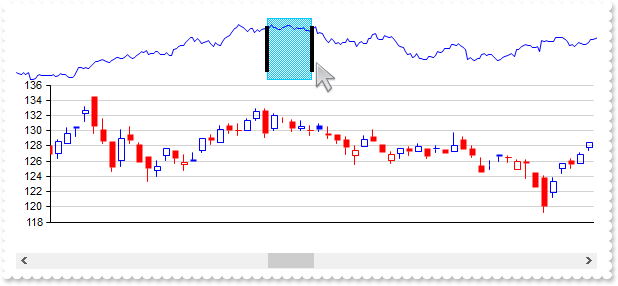
Shows the value-scroll (vertical scroll bar for area-compatible chart types)
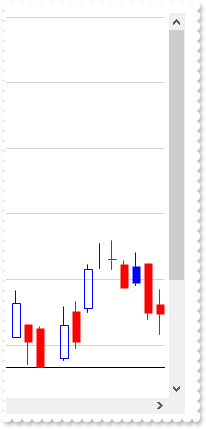
with thisform.Graph1
.BeginUpdate
.ValueSize = 8
.Object.Misc(31) = 1.5
.Data = "C:\Program Files\Exontrol\ExGraph\Sample\Data/msft.csv"
with .Series.Add()
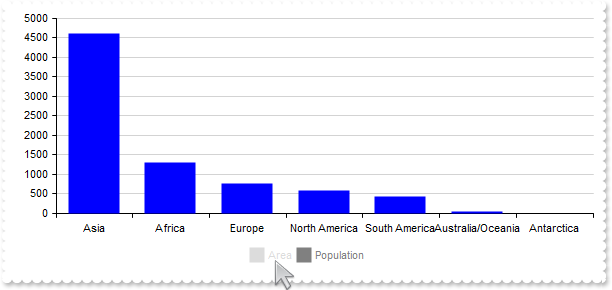
.Name = "msft"
.Data = "Open,High,Low,Close"
.Type = "candle"
endwith
.EndUpdate
endwith
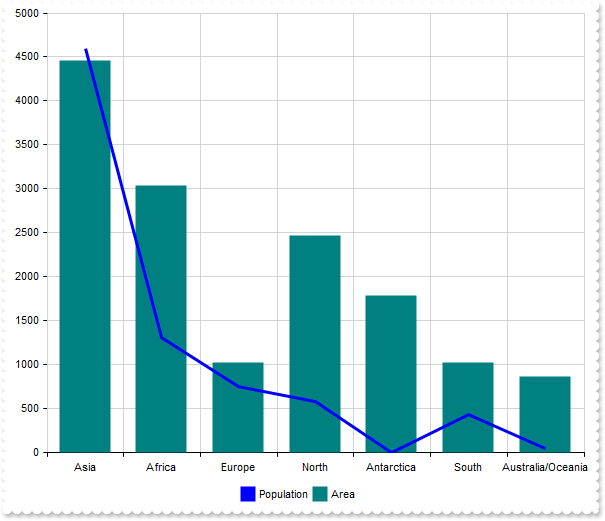
|
|
192
|
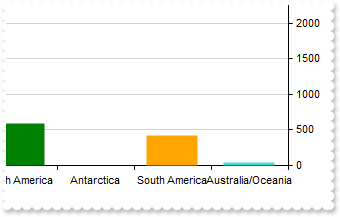
No values are shown
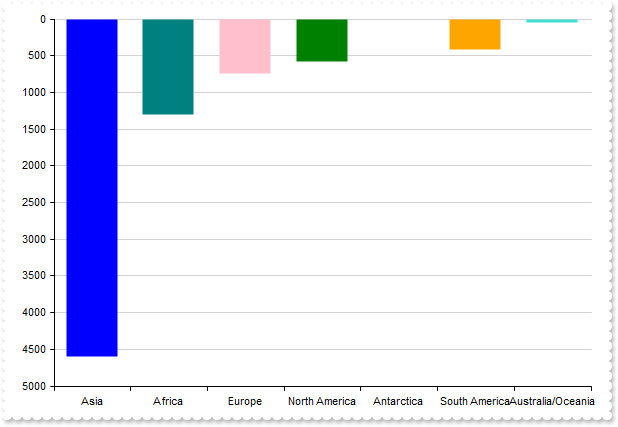
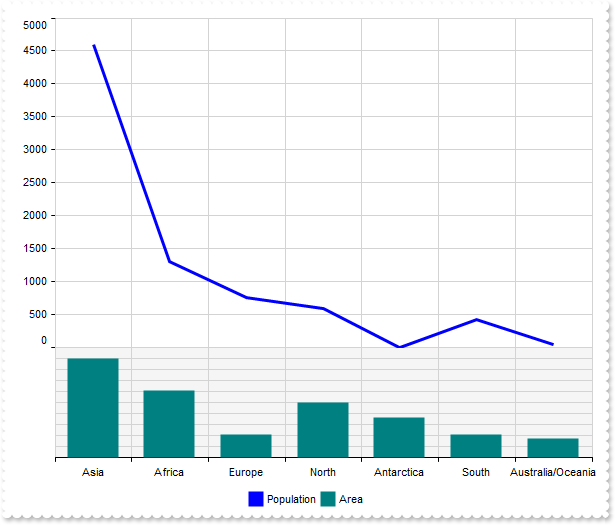
with thisform.Graph1
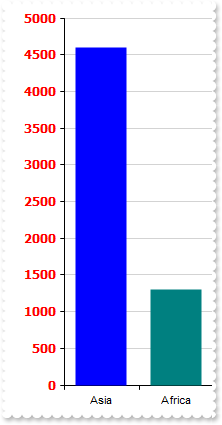
.BeginUpdate
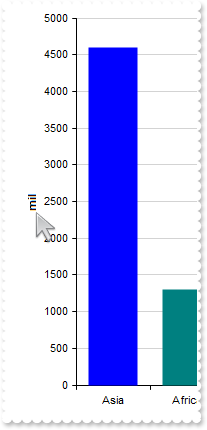
.Object.Misc(29) = 0
with .CategoryAxis
.Categories = "China,India,United States,Indonesia,Pakistan,Brazil,"
.MajorGridLines.Color = "lightgray"
endwith
with .Series.Add("1410,1390,331,276,225,213")
.ShowValue = 7 && ShowValueEnum.exValue Or ShowValueEnum.exLine Or ShowValueEnum.exPoint
.ValueFormat = "`<c>` + category + `<br><c>` + value"
endwith
.EndUpdate
endwith
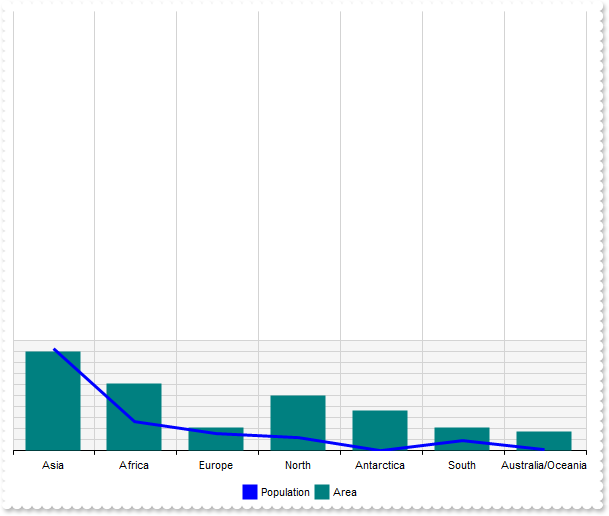
|
|
191
|
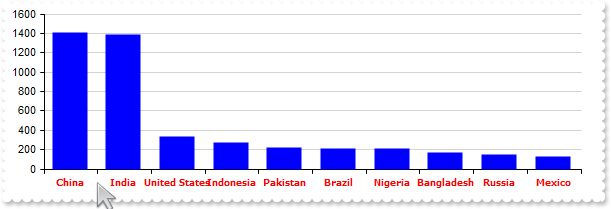
No labels on category-axis are shown
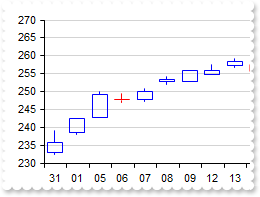
with thisform.Graph1
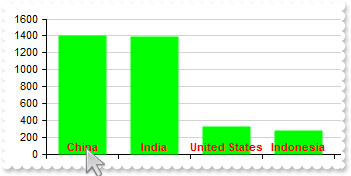
.BeginUpdate
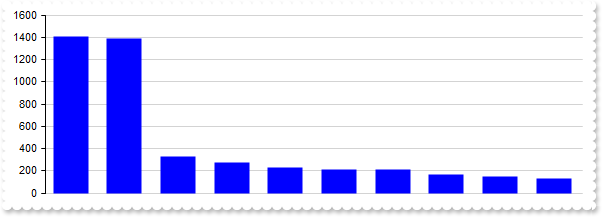
.ValueSize = 15
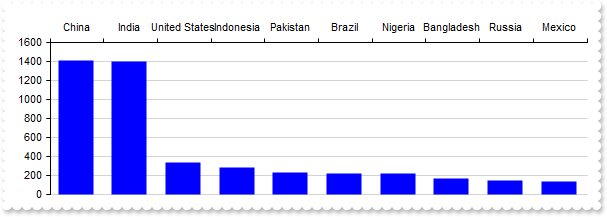
.Object.Misc(28) = 0
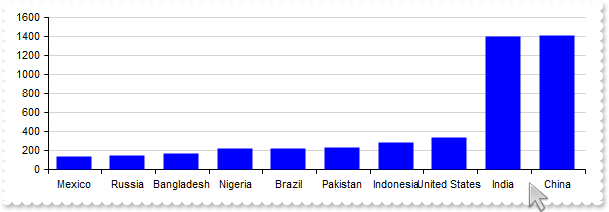
with .CategoryAxis
.Categories = "Date"
.Format = "value mid 9 left 2"
endwith
.Data = "C:\Program Files\Exontrol\ExGraph\Sample\Data/msft.csv"
with .Series.Add()
.Name = "msft"
.Data = "Open,High,Low,Close"
.Type = "candle"
endwith
.EndUpdate
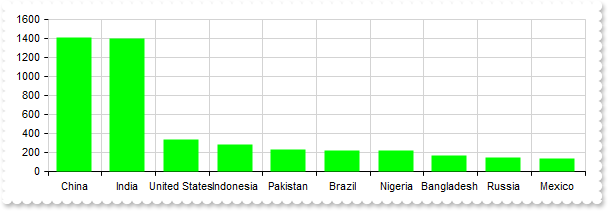
endwith
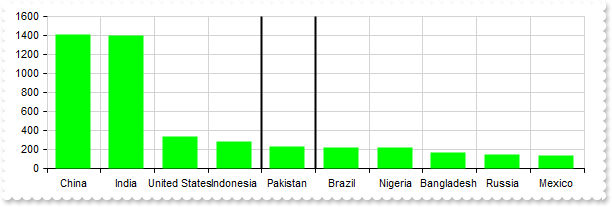
|
|
190
|
No category grid lins are shown
with thisform.Graph1
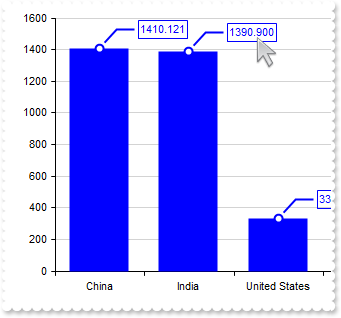
.BeginUpdate
.ValueSize = 8
.Object.Misc(27) = 0
.CategoryAxis.MajorGridLines.Color = "lightgray"
.Data = "C:\Program Files\Exontrol\ExGraph\Sample\Data/msft.csv"
with .Series.Add()
.Name = "msft"
.Data = "Open,High,Low,Close"
.Type = "candle"
endwith
.EndUpdate
endwith
|
|
189
|
No category ticks are shown
with thisform.Graph1
	.BeginUpdate
	.ValueSize = 8
	.Object.Misc(26) = 0
	.Data = "C:\Program Files\Exontrol\ExGraph\Sample\Data/msft.csv"
	with .Series.Add()
		.Name = "msft"
		.Data = "Open,High,Low,Close"
		.Type = "candle"
	endwith
	.EndUpdate
endwith
|
|
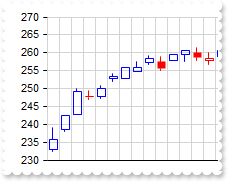
188
|
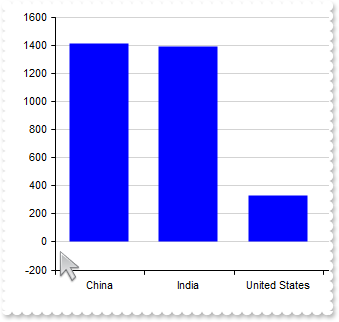
Define the lower and upper margins of the valueSize property (CTRL + Middle button and drag to resize the values)
with thisform.Graph1
	.BeginUpdate
	.ValueSize = 8
	.Object.Misc(25) = "1,12"
	.Data = "C:\Program Files\Exontrol\ExGraph\Sample\Data/msft.csv"
	with .Series.Add()
		.Name = "msft"
		.Data = "Open,High,Low,Close"
		.Type = "candle"
	endwith
	.EndUpdate
endwith
|
|
187
|
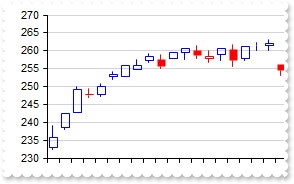
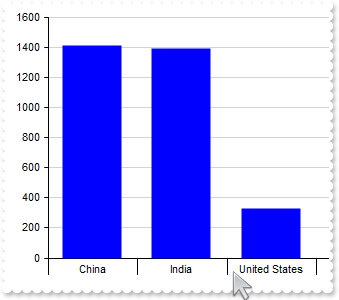
Even though I set the AutoFit property to False, the control still gets resized when I click CTRL + Middle button
with thisform.Graph1
	.BeginUpdate
	.ValueSize = 8
	.Object.Misc(25) = "0,8"
	with .CategoryAxis
		.Categories = "China,India,United States,Indonesia,Pakistan,Brazil,"
		.MajorGridLines.Color = "lightgray"
	endwith
	.Series.Add("1410,1390,331,276,225,213")
	.EndUpdate
endwith
|
|
186
|
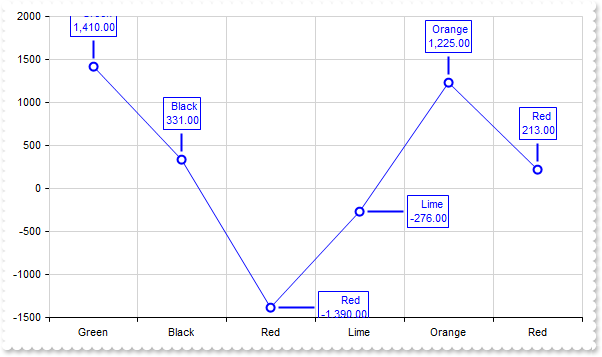
Define the angle (in degrees) the value-line is rotated by, when the values goes up(positive) or down(negative)
with thisform.Graph1
	.BeginUpdate
	.AutoFit = .T.
	.Object.Misc(23) = 0
	.Object.Misc(24) = 90
	with .CategoryAxis
		.Categories = "Green,Black,Red,Lime,Orange,Red"
		.MajorGridLines.Color = "lightgray"
	endwith
	with .Series.Add("1410,331,-1390,-276,1225,213")
		.ShowValue = 7 && ShowValueEnum.exValue Or ShowValueEnum.exLine Or ShowValueEnum.exPoint
		.ValueFormat = "`<c>` + category + `<br><c>` + (value format ``)"
		.Type = "line"
	endwith
	.EndUpdate
endwith
|
|
185
|
Define the additional angle (in degrees) the value-line is rotated by
with thisform.Graph1
	.BeginUpdate
	.AutoFit = .T.
	.Object.Misc(22) = 0
	with .CategoryAxis
		.Categories = "China,India,United States,Indonesia,Pakistan,Brazil,"
		.MajorGridLines.Color = "lightgray"
	endwith
	with .Series.Add("1410,1390,331,276,225,213")
		.ShowValue = 7 && ShowValueEnum.exValue Or ShowValueEnum.exLine Or ShowValueEnum.exPoint
		.ValueFormat = "`<c>` + category + `<br><c>` + (percent format ``) + `%`"
	endwith
	.EndUpdate
endwith
|
|
184
|
Define the distance to extend the value-line by
with thisform.Graph1
	.BeginUpdate
	.AutoFit = .T.
	.Object.Misc(21) = 12
	with .CategoryAxis
		.Categories = "China,India,United States,Indonesia,Pakistan,Brazil,"
		.MajorGridLines.Color = "lightgray"
	endwith
	with .Series.Add("1410,1390,331,276,225,213")
		.ShowValue = 7 && ShowValueEnum.exValue Or ShowValueEnum.exLine Or ShowValueEnum.exPoint
		.ValueFormat = "`<c>` + category + `<br><c>` + value"
	endwith
	.EndUpdate
endwith
|
|
183
|
Define the distance from the edge of the outer circle where the values are displayed
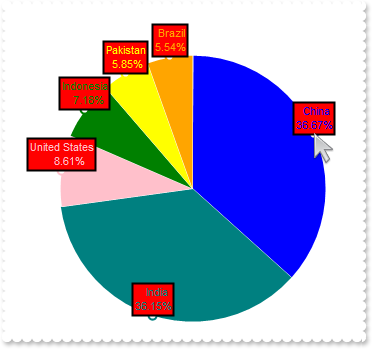
with thisform.Graph1
	.BeginUpdate
	.Object.Misc(20) = 0
	with .CategoryAxis
		.Categories = "China,India,United States,Indonesia,Pakistan,Brazil"
		.MajorGridLines.Color = "lightgray"
	endwith
	with .Series.Add("1410,1390,331,276,225,213")
		.Type = "Pie"
		.ShowValue = 7 && ShowValueEnum.exValue Or ShowValueEnum.exLine Or ShowValueEnum.exPoint
		.ValueFormat = "`<c>` + category + `<br><c>` + (percent format ``) + `%`"
	endwith
	.ValuePoint = ",,,,,,,red,black,2"
	.EndUpdate
endwith
|
|
182
|
Define the distance from the edge of the inner circle where the values are displayed
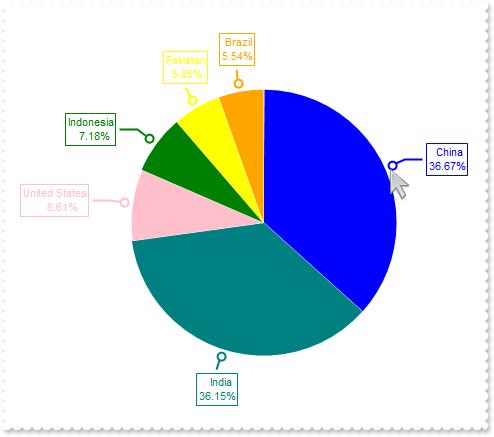
with thisform.Graph1
	.BeginUpdate
	.Object.Misc(19) = 8
	with .CategoryAxis
		.Categories = "China,India,United States,Indonesia,Pakistan,Brazil"
		.MajorGridLines.Color = "lightgray"
	endwith
	with .Series.Add("1410,1390,331,276,225,213")
		.Type = "Pie"
		.ShowValue = 7 && ShowValueEnum.exValue Or ShowValueEnum.exLine Or ShowValueEnum.exPoint
		.ValueFormat = "`<c>` + category + `<br><c>` + (percent format ``) + `%`"
	endwith
	.EndUpdate
endwith
|
|
181
|
Define the padding between rings of the "pie" chart-type
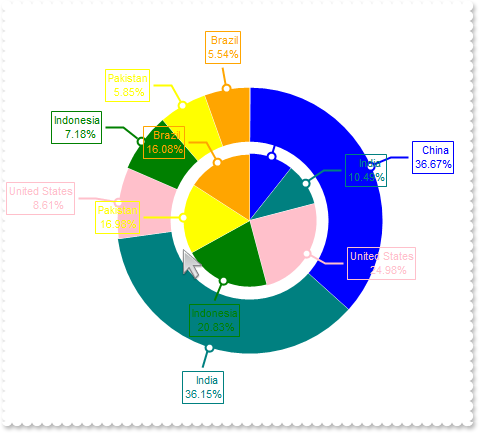
with thisform.Graph1
	.BeginUpdate
	.Object.Misc(18) = 12
	with .CategoryAxis
		.Categories = "China,India,United States,Indonesia,Pakistan,Brazil"
		.MajorGridLines.Color = "lightgray"
	endwith
	with .Series.Add("1410,1390,331,276,225,213")
		.Type = "Pie"
		.ShowValue = 7 && ShowValueEnum.exValue Or ShowValueEnum.exLine Or ShowValueEnum.exPoint
		.ValueFormat = "`<c>` + category + `<br><c>` + (percent format ``) + `%`"
	endwith
	with .Series.Add("141,139,331,276,225,213")
		.Type = "Pie"
		.ShowValue = 7 && ShowValueEnum.exValue Or ShowValueEnum.exLine Or ShowValueEnum.exPoint
		.ValueFormat = "`<c>` + category + `<br><c>` + (percent format ``) + `%`"
	endwith
	.EndUpdate
endwith
|
|
180
|
Requests for a new layout once the serie's visible property is changed
with thisform.Graph1
	.BeginUpdate
	.Object.Misc(17) = .F.
	with .CategoryAxis
		.Categories = "China,India,United States,Indonesia,Pakistan,Brazil"
		.MajorGridLines.Color = "lightgray"
	endwith
	with .Series.Add("1410,1390,331,276,225,213")
		.Type = "Pie"
		.ShowValue = 7 && ShowValueEnum.exValue Or ShowValueEnum.exLine Or ShowValueEnum.exPoint
		.ValueFormat = "`<c>` + category + `<br><c>` + (percent format ``) + `%`"
	endwith
	.Legend.Visible = .T.
	.EndUpdate
endwith
|
|
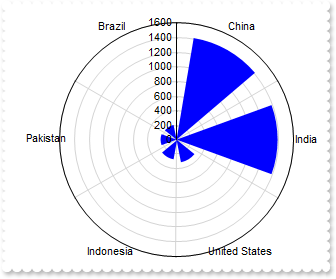
179
|
Prevents rotating the labels
with thisform.Graph1
	.BeginUpdate
	.AutoFit = .T.
	.Object.Misc(16) = .F.
	with .CategoryAxis
		.Categories = "China,India,United States,Indonesia,Pakistan,Brazil"
		.MajorGridLines.Color = "lightgray"
	endwith
	.Series.Add("1410,1390,331,276,225,213").Type = "radarColumn"
	.SeriesColors = "blue"
	.EndUpdate
endwith
|
|
178
|
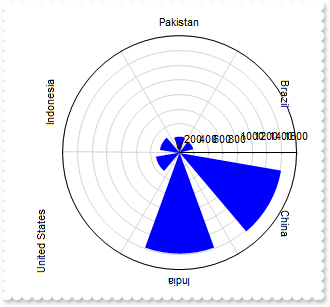
Define the angle (in degrees) to start the circular-compatible charts (radial or pie)
with thisform.Graph1
	.BeginUpdate
	.AutoFit = .T.
	.Object.Misc(15) = 0
	with .CategoryAxis
		.Categories = "China,India,United States,Indonesia,Pakistan,Brazil"
		.MajorGridLines.Color = "lightgray"
	endwith
	.Series.Add("1410,1390,331,276,225,213").Type = "radarColumn"
	.SeriesColors = "blue"
	.EndUpdate
endwith
|
|
177
|
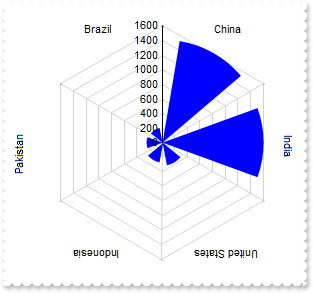
Defines polygonal instead of circular
with thisform.Graph1
	.BeginUpdate
	.AutoFit = .T.
	.Object.Misc(14) = .T.
	with .CategoryAxis
		.Categories = "China,India,United States,Indonesia,Pakistan,Brazil"
		.MajorGridLines.Color = "lightgray"
	endwith
	.Series.Add("1410,1390,331,276,225,213").Type = "radarColumn"
	.SeriesColors = "blue"
	.EndUpdate
endwith
|
|
176
|
Define the distance (proportionally with the valueSize property) between the first, next and last value of the same category and its border
with thisform.Graph1
	.BeginUpdate
	.AutoFit = .T.
	.Object.Misc(11) = 0.5
	.Object.Misc(12) = 0.5
	.CategoryAxis.Categories = "China,India,United States,Indonesia,Pakistan,Brazil"
	.Series.Add("1410,1390,331,276,225,213")
	.Series.Add("9900,3300,980,190,90,8")
	.EndUpdate
endwith
|
|
175
|
Ensures that the marginal labels of the value-axis ensure fit the axis's client-rectangle
with thisform.Graph1
	.BeginUpdate
	.AutoFit = .T.
	.Object.Misc(13) = .T.
	.CategoryAxis.Categories = "China,India,United States,Indonesia,Pakistan,Brazil"
	.Series.Add("1410,1390,331,276,225,213")
	.SeriesColors = "blue"
	.EndUpdate
endwith
|
|
174
|
Prevents updating the margins/minimum/maximum of the value-axis when the user scrolls the data
with thisform.Graph1
	.BeginUpdate
	.ValueSize = 6
	.Object.Misc(10) = 0
	.Data = "C:\Program Files\Exontrol\ExGraph\Sample\Data/msft.csv"
	with .Series.Add()
		.Data = "Volume"
		.Type = "candle"
	endwith
	.EndUpdate
endwith
|
|
173
|
Define the padding for labels and title of the value-axis
with thisform.Graph1
	.BeginUpdate
	.AutoFit = .T.
	.Object.Misc(9) = 16
	.CategoryAxis.Categories = "China,India,United States,Indonesia,Pakistan,Brazil"
	.Series.Add("1410,1390,331,276,225,213")
	.SeriesColors = "blue"
	.EndUpdate
endwith
|
|
172
|
Define the size (height for horizontal axis and width for vertical axis) to display the category-axis (line and ticks)
with thisform.Graph1
	.BeginUpdate
	.AutoFit = .T.
	.Object.Misc(8) = 16
	.ValueAxis.OffsetLabel = "16,16"
	.CategoryAxis.Categories = "China,India,United States,Indonesia,Pakistan,Brazil"
	.Series.Add("1410,1390,331,276,225,213")
	.SeriesColors = "blue"
	.EndUpdate
endwith
|
|
171
|
Define the padding for labels and title of the category-axis
with thisform.Graph1
	.BeginUpdate
	.AutoFit = .T.
	.Object.Misc(7) = 16
	.CategoryAxis.Categories = "China,India,United States,Indonesia,Pakistan,Brazil"
	.Series.Add("1410,1390,331,276,225,213")
	.SeriesColors = "blue"
	.EndUpdate
endwith
|
|
170
|
Define the size (height for horizontal axis and width for vertical axis) to display the category-axis (line and ticks)
with thisform.Graph1
	.BeginUpdate
	.AutoFit = .T.
	.Object.Misc(6) = 16
	with .CategoryAxis
		.Categories = "China,India,United States,Indonesia,Pakistan,Brazil"
		.OffsetLabel = "0,-16"
	endwith
	.Series.Add("1410,1390,331,276,225,213")
	.SeriesColors = "blue"
	.EndUpdate
endwith
|
|
169
|
Define the minimum/maximum portion (as a proportion of major unit, as a numeric-value between 0 and 1) to extend the axis before the first/after the last value of the serie (minimum, maximum value)
with thisform.Graph1
	.BeginUpdate
	.AutoFit = .T.
	.Object.Misc(4) = 1
	.Object.Misc(5) = 1
	.CategoryAxis.Categories = "China,India,United States,Indonesia,Pakistan,Brazil"
	.Series.Add("1410,1390,331,276,225,213")
	.SeriesColors = "blue"
	.EndUpdate
endwith
|
|
168
|
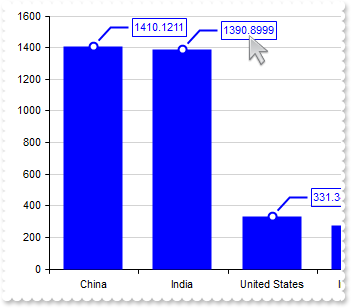
Define the number of digits to appear after the decimal point (as it is)
with thisform.Graph1
	.BeginUpdate
	.AutoFit = .T.
	.Object.Misc(3) = -1
	.CategoryAxis.Categories = "China,India,United States,Indonesia,Pakistan,Brazil"
	.Series.Add("1410.1211,1390.8999,331.3421,276.8991,225.0023,213.2231").ShowValue = 7 && ShowValueEnum.exValue Or ShowValueEnum.exLine Or ShowValueEnum.exPoint
	.SeriesColors = "blue"
	.EndUpdate
endwith
|
|
167
|
Define the number of digits to appear after the decimal point
with thisform.Graph1
	.BeginUpdate
	.AutoFit = .T.
	.Object.Misc(3) = 3
	.CategoryAxis.Categories = "China,India,United States,Indonesia,Pakistan,Brazil"
	.Series.Add("1410.1211,1390.8999,331.3421,276.8991,225.0023,213.2231").ShowValue = 7 && ShowValueEnum.exValue Or ShowValueEnum.exLine Or ShowValueEnum.exPoint
	.SeriesColors = "blue"
	.EndUpdate
endwith
|
|
166
|
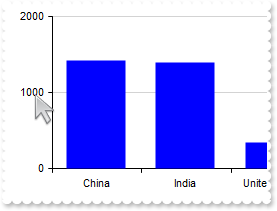
Define the inferior and superior limits of the number of major-unit intervals an axis can display
with thisform.Graph1
	.BeginUpdate
	.AutoFit = .T.
	.Object.Misc(2) = "2"
	.CategoryAxis.Categories = "China,India,United States,Indonesia,Pakistan,Brazil"
	.Series.Add("1410,1390,331,276,225,213")
	.SeriesColors = "blue"
	.EndUpdate
endwith
|
|
165
|
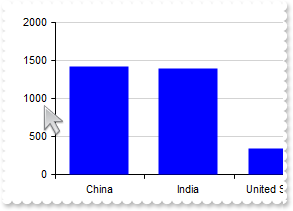
Define the base major-units alternatives (separated by comma) the control uses to calculate the major-unit for the axes
with thisform.Graph1
	.BeginUpdate
	.AutoFit = .T.
	.Object.Misc(1) = "5"
	.CategoryAxis.Categories = "China,India,United States,Indonesia,Pakistan,Brazil"
	.Series.Add("1410,1390,331,276,225,213")
	.SeriesColors = "blue"
	.EndUpdate
endwith
|
|
164
|
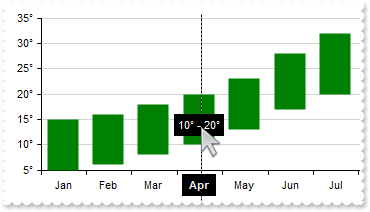
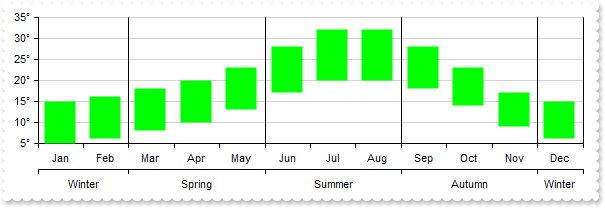
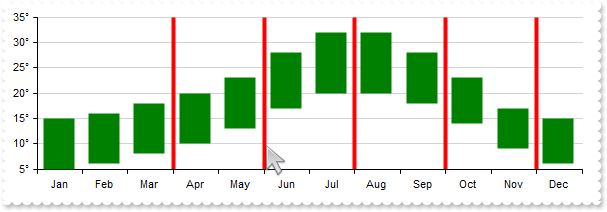
Customizes the tooltips to show on category-axis, when the crosshair intersects the category-axis
with thisform.Graph1
	.BeginUpdate
	.AutoFit = .T.
	with .ValueAxis
		.Format = "value + `°`"
		.CursorFormat = "``"
	endwith
	.CategoryAxis.CursorFormat = "`<b><fgcolor F0F0F0> ` + value + ` `"
	var_s = "Jan(5 15), Feb(6 16), Mar(8 18), Apr(10 20), May(13 23), Jun(17 28), Jul(20 32), Aug(20 32), Sep(18 28), Oct(14 23), Nov(9 17), "
	var_s = var_s + "Dec(6 15)"
	with .Series.Add(var_s,"Spain")
		.Type = "RangeColumn"
		.CursorFormat = "%V0 +`° - ` + %V1 + `°`"
	endwith
	.SeriesColors = "green"
	with .Cursor
		.Visible = .T.
		.SerieTooltipBackColor = "black"
		.SerieTooltipForeColor = "rgb(254,254,254)"
		.TooltipPad = 4
		.ShowCursorValueLine = .F.
	endwith
	.EndUpdate
endwith
|
|
163
|
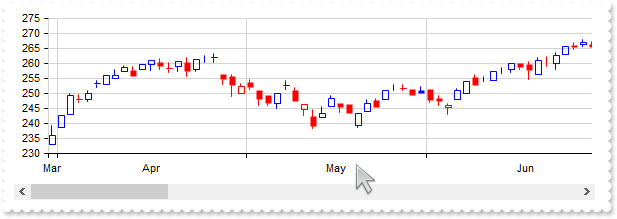
Define the configuration options to show the grid lines and labels between for the overview panel
with thisform.Graph1
	.BeginUpdate
	with .ValueAxis
		.Format = "value / 1000000"
		.MajorUnit = 50000000
	endwith
	with .CategoryAxis.OverviewGridLines
		.Format = "`<fgcolor red><b>` + (value left 4)"
		.Color = "red"
		.Style = 1
		.Width = 2
	endwith
	.Data = "C:\Program Files\Exontrol\ExGraph\Sample\Data/msft.csv"
	.SeriesColors = "blue"
	.Series.Add("Volume")
	.Overview.Visible = .T.
	.EndUpdate
endwith
|
|
162
|
Add additional grid-lines for categories
with thisform.Graph1
	.BeginUpdate
	.AutoFit = .T.
	with .CategoryAxis
		.Categories = "China,India,United States,Indonesia,Pakistan,Brazil,Nigeria,Bangladesh,Russia,Mexico"
		.MajorGridLines.Color = "lightgray"
		with .ChartGridLines
			.Format = "value = `Pakistan`"
			.Align = 1024
			.Width = 2
			.Color = "black"
			.Skip = 1
		endwith
	endwith
	.Series.Add("1410,1390,331,276,225,213,211,166,145,130")
	.SeriesColors = "lime"
	.EndUpdate
endwith
|
|
161
|
Add grid-lines for categories
with thisform.Graph1
	.BeginUpdate
	.AutoFit = .T.
	with .CategoryAxis
		.Categories = "China,India,United States,Indonesia,Pakistan,Brazil,Nigeria,Bangladesh,Russia,Mexico"
		.MajorGridLines.Color = "lightgray"
	endwith
	.Series.Add("1410,1390,331,276,225,213,211,166,145,130")
	.SeriesColors = "lime"
	.EndUpdate
endwith
|
|
160
|
Shifts horizontally or vertically the labels relative to their original positions
with thisform.Graph1
	.BeginUpdate
	.ValueSize = 48
	with .CategoryAxis
		.Categories = "China,India,United States,Indonesia,Pakistan,Brazil,Nigeria,Bangladesh,Russia,Mexico"
		.OffsetLabel = "0,-22"
		.Tfi = "<fgcolor red> bold"
	endwith
	.Series.Add("1410,1390,331,276,225,213,211,166,145,130")
	.SeriesColors = "lime"
	.EndUpdate
endwith
|
|
159
|
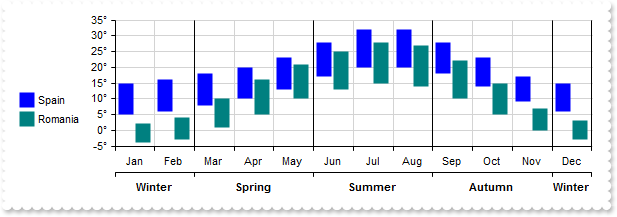
Combines/Merges categories sharing consecutive names according to the Format property
with thisform.Graph1
	.BeginUpdate
	.AutoFit = .T.
	.CategoryAxis.Visible = .T.
	with .CategoryAxes.Add("Winter,Winter,Spring,Spring,Spring,Summer,Summer,Summer,Autumn,Autumn,Autumn,Winter")
		.Format = "value"
		.Split = .T.
		.MajorGridLines.Color = "black"
	endwith
	.ValueAxis.Format = "value + `°`"
	var_s = "Jan(5 15), Feb(6 16), Mar(8 18), Apr(10 20), May(13 23), Jun(17 28), Jul(20 32), Aug(20 32), Sep(18 28), Oct(14 23), Nov(9 17), "
	var_s = var_s + "Dec(6 15)"
	.Series.Add(var_s,"Spain").Type = "RangeColumn"
	.SeriesColors = "lime"
	.EndUpdate
endwith
|
|
158
|
Combines/Merges categories sharing consecutive names according to the Format property
with thisform.Graph1
	.BeginUpdate
	.ValueSize = 6
	.Data = "C:\Program Files\Exontrol\ExGraph\Sample\Data/msft.csv"
	with .CategoryAxis
		.Categories = "Date"
		.Format = "dateS(value left 7) format `MMM`"
		.Split = .T.
		.MajorGridLines.Color = "lightgray"
	endwith
	with .Series.Add()
		.Name = "msft"
		.Data = "Open,High,Low,Close"
		.Type = "candle"
	endwith
	.EndUpdate
endwith
|
|
157
|
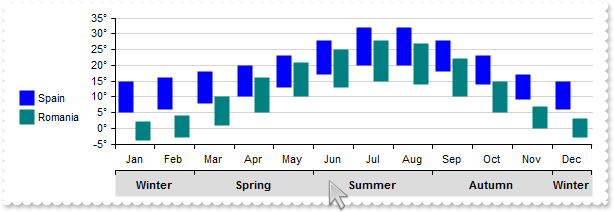
Define the category-axis's background color
with thisform.Graph1
	.BeginUpdate
	.AutoFit = .T.
	.CategoryAxis.Visible = .T.
	with .CategoryAxes.Add("Winter,Winter,Spring,Spring,Spring,Summer,Summer,Summer,Autumn,Autumn,Autumn,Winter")
		.Format = "value"
		.Split = .T.
		.Tfi = "bold"
		.Color = 14474460
	endwith
	.ValueAxis.Format = "value + `°`"
	var_s = "Jan(5 15), Feb(6 16), Mar(8 18), Apr(10 20), May(13 23), Jun(17 28), Jul(20 32), Aug(20 32), Sep(18 28), Oct(14 23), Nov(9 17), "
	var_s = var_s + "Dec(6 15)"
	.Series.Add(var_s,"Spain").Type = "RangeColumn"
	var_s1 = "Jan(-4 2), Feb(-3 4), Mar(1 10), Apr(5 16), May(10 21), Jun(13 25), Jul(15 28), Aug(14 27), Sep(10 22), Oct(5 15), Nov(0 7), Dec"
	var_s1 = var_s1 + "(-3 3)"
	.Series.Add(var_s1,"Romania").Type = "RangeColumn"
	with .Legend
		.Visible = .T.
		.Dock = 3
	endwith
	.EndUpdate
endwith
|
|
156
|
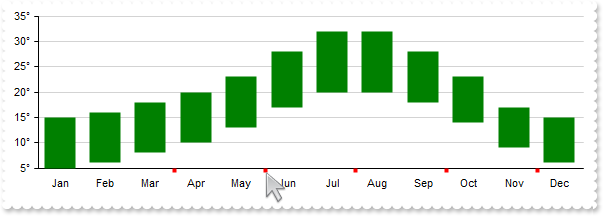
Define the color, size, style, skip and step configuration options of the major ticks to be shown on the value-axis
with thisform.Graph1
	.BeginUpdate
	.AutoFit = .T.
	.ValueAxis.Format = "value + `°`"
	with .CategoryAxis.MajorTicks
		.Color = "red"
		.Width = 4
		.Style = 0
		.Skip = 3
		.Step = 2
	endwith
	var_s = "Jan(5 15), Feb(6 16), Mar(8 18), Apr(10 20), May(13 23), Jun(17 28), Jul(20 32), Aug(20 32), Sep(18 28), Oct(14 23), Nov(9 17), "
	var_s = var_s + "Dec(6 15)"
	.Series.Add(var_s,"Spain").Type = "RangeColumn"
	.SeriesColors = "green"
	.EndUpdate
endwith
|
|
155
|
Define the color, size, style, skip and step configuration options of the major grid-lines to be shown by the value-axis on the chart panel
with thisform.Graph1
	.BeginUpdate
	.AutoFit = .T.
	.ValueAxis.Format = "value + `°`"
	with .CategoryAxis.MajorGridLines
		.Color = "red"
		.Width = 4
		.Style = 0
		.Skip = 3
		.Step = 2
	endwith
	var_s = "Jan(5 15), Feb(6 16), Mar(8 18), Apr(10 20), May(13 23), Jun(17 28), Jul(20 32), Aug(20 32), Sep(18 28), Oct(14 23), Nov(9 17), "
	var_s = var_s + "Dec(6 15)"
	.Series.Add(var_s,"Spain").Type = "RangeColumn"
	.SeriesColors = "green"
	.EndUpdate
endwith
|
|
154
|
Define the color, size and style to display the line of the category-axis
with thisform.Graph1
	.BeginUpdate
	.AutoFit = .T.
	.ValueAxis.Format = "value + `°`"
	with .CategoryAxis.AxisLine
		.Color = "red"
		.Width = 2
		.Style = 0
	endwith
	var_s = "Jan(5 15), Feb(6 16), Mar(8 18), Apr(10 20), May(13 23), Jun(17 28), Jul(20 32), Aug(20 32), Sep(18 28), Oct(14 23), Nov(9 17), "
	var_s = var_s + "Dec(6 15)"
	.Series.Add(var_s,"Spain").Type = "RangeColumn"
	.SeriesColors = "green"
	.EndUpdate
endwith
|
|
153
|
Specifies the rotation angle (in degrees) for the title and labels of the category-axis, in 'labels,title' format
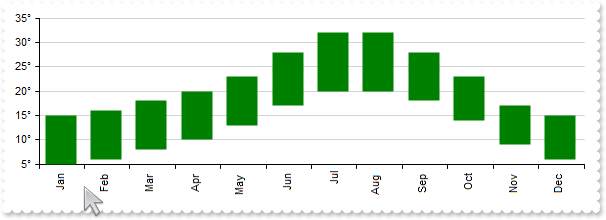
with thisform.Graph1
	.BeginUpdate
	.AutoFit = .T.
	.ValueAxis.Format = "value + `°`"
	.CategoryAxis.Angle = "-90"
	var_s = "Jan(5 15), Feb(6 16), Mar(8 18), Apr(10 20), May(13 23), Jun(17 28), Jul(20 32), Aug(20 32), Sep(18 28), Oct(14 23), Nov(9 17), "
	var_s = var_s + "Dec(6 15)"
	.Series.Add(var_s,"Spain").Type = "RangeColumn"
	.SeriesColors = "green"
	.EndUpdate
endwith
|
|
152
|
Define the title of the category-axis
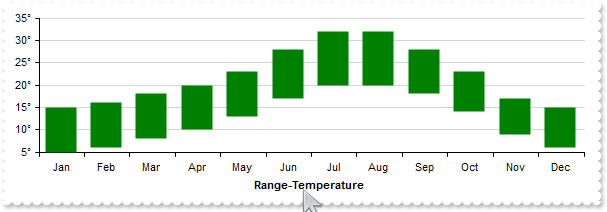
with thisform.Graph1
	.BeginUpdate
	.AutoFit = .T.
	.ValueAxis.Format = "value + `°`"
	.CategoryAxis.Title = "<b>Range-Temperature"
	var_s = "Jan(5 15), Feb(6 16), Mar(8 18), Apr(10 20), May(13 23), Jun(17 28), Jul(20 32), Aug(20 32), Sep(18 28), Oct(14 23), Nov(9 17), "
	var_s = var_s + "Dec(6 15)"
	.Series.Add(var_s,"Spain").Type = "RangeColumn"
	.SeriesColors = "green"
	.EndUpdate
endwith
|
|
151
|
Changes the font attributes to apply on the title and labels of the category-axis
with thisform.Graph1
	.BeginUpdate
	.AutoFit = .T.
	with .CategoryAxis
		.Categories = "China,India,United States,Indonesia,Pakistan,Brazil,Nigeria,Bangladesh,Russia,Mexico"
		.Tfi = "<fgcolor red> Tahoma 7 bold"
	endwith
	.Series.Add("1410,1390,331,276,225,213,211,166,145,130")
	.SeriesColors = "blue"
	.EndUpdate
endwith
|
|
150
|
Define the direction of the category axis
with thisform.Graph1
	.BeginUpdate
	.AutoFit = .T.
	with .CategoryAxis
		.Categories = "China,India,United States,Indonesia,Pakistan,Brazil,Nigeria,Bangladesh,Russia,Mexico"
		.Reverse = .T.
	endwith
	.Series.Add("1410,1390,331,276,225,213,211,166,145,130")
	.SeriesColors = "blue"
	.EndUpdate
endwith
|
|
149
|
Aligns the category-axis to bottom/right or top/left side of the view
with thisform.Graph1
	.BeginUpdate
	.AutoFit = .T.
	with .CategoryAxis
		.Categories = "China,India,United States,Indonesia,Pakistan,Brazil,Nigeria,Bangladesh,Russia,Mexico"
		.Align = 0
	endwith
	.Series.Add("1410,1390,331,276,225,213,211,166,145,130")
	.SeriesColors = "blue"
	.EndUpdate
endwith
|
|
148
|
Hides the category axis
with thisform.Graph1
	.BeginUpdate
	.AutoFit = .T.
	with .CategoryAxis
		.Categories = "China,India,United States,Indonesia,Pakistan,Brazil,Nigeria,Bangladesh,Russia,Mexico"
		.Visible = .F.
	endwith
	.Series.Add("1410,1390,331,276,225,213,211,166,145,130")
	.SeriesColors = "blue"
	.EndUpdate
endwith
|
|
147
|
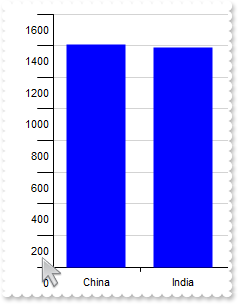
Customizes the labels to show on category axis
with thisform.Graph1
	.BeginUpdate
	.AutoFit = .T.
	with .CategoryAxis
		.Categories = "China,India,United States,Indonesia,Pakistan,Brazil,Nigeria,Bangladesh,Russia,Mexico"
		.Format = "(index < 2 ? `<b>` : `<fgcolor gray>`) + value"
	endwith
	.Series.Add("1410,1390,331,276,225,213,211,166,145,130")
	.SeriesColors = "blue"
	.EndUpdate
endwith
|
|
146
|
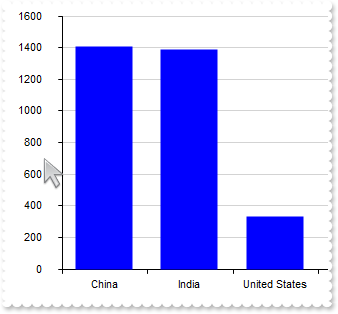
Define the categories (method 2)

with thisform.Graph1
	.BeginUpdate
	.AutoFit = .T.
	var_s = "China(1410),India(1390),United States(331),Indonesia(276),Pakistan(225),Brazil(213),Nigeria(211),Bangladesh(166),Russia(145),Mex"
	var_s = var_s + "ico(130)"
	.Series.Add(var_s)
	.SeriesColors = "blue"
	.EndUpdate
endwith
|
|
145
|
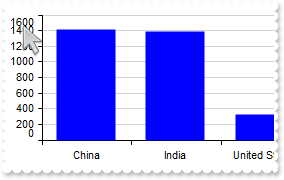
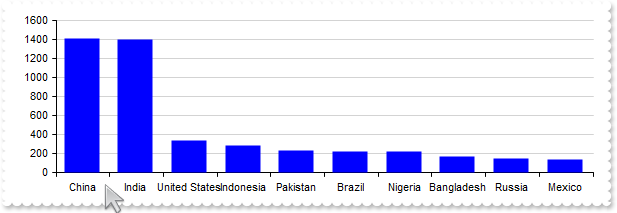
Define the categories (method 1)
with thisform.Graph1
	.BeginUpdate
	.AutoFit = .T.
	.CategoryAxis.Categories = "China,India,United States,Indonesia,Pakistan,Brazil,Nigeria,Bangladesh,Russia,Mexico"
	.Series.Add("1410,1390,331,276,225,213,211,166,145,130")
	.SeriesColors = "blue"
	.EndUpdate
endwith
|
|
144
|
Adds multiple category-axes
with thisform.Graph1
.BeginUpdate
.AutoFit = .T.
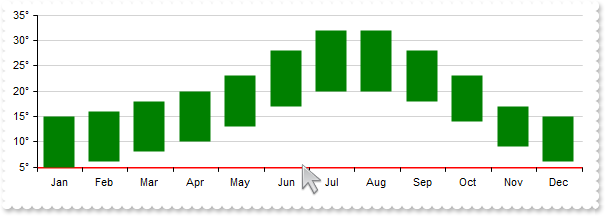
.CategoryAxis.MajorGridLines.Color = "lightgray"
with .CategoryAxes.Add("Winter,Winter,Spring,Spring,Spring,Summer,Summer,Summer,Autumn,Autumn,Autumn,Winter")
.Format = "value"
.Split = .T.
.Tfi = "bold"
.MajorGridLines.Color = "black"
endwith
.ValueAxis.Format = "value + `°`"
var_s = "Jan(5 15), Feb(6 16), Mar(8 18), Apr(10 20), May(13 23), Jun(17 28), Jul(20 32), Aug(20 32), Sep(18 28), Oct(14 23), Nov(9 17), "
var_s = var_s + "Dec(6 15)"
.Series.Add(var_s,"Spain").Type = "RangeColumn"
var_s1 = "Jan(-4 2), Feb(-3 4), Mar(1 10), Apr(5 16), May(10 21), Jun(13 25), Jul(15 28), Aug(14 27), Sep(10 22), Oct(5 15), Nov(0 7), Dec"
var_s1 = var_s1 + "(-3 3)"
.Series.Add(var_s1,"Romania").Type = "RangeColumn"
with .Legend
.Visible = .T.
.Dock = 3
endwith
.EndUpdate
endwith
|
|
143
|
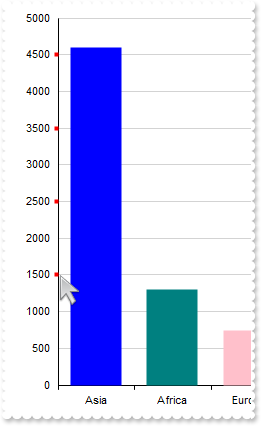
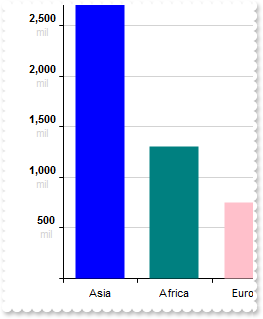
ReDefine the major-unit of the value-axis
with thisform.Graph1
	.BeginUpdate
	.AutoFit = .T.
	.ValueAxis.MajorUnit = 1000
	.CategoryAxis.Categories = "Asia,Africa,Europe,North America,Antarctica,South America,Australia/Oceania"
	with .Series
		with .Add("4600,1300,747,579,0,422,42")
			.Name = "Population"
			.Misc(6) = 3
		endwith
	endwith
	.EndUpdate
endwith
|
|
142
|
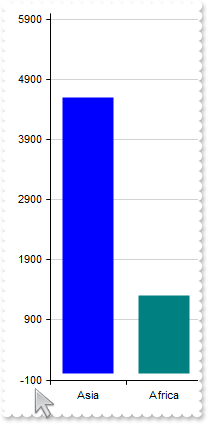
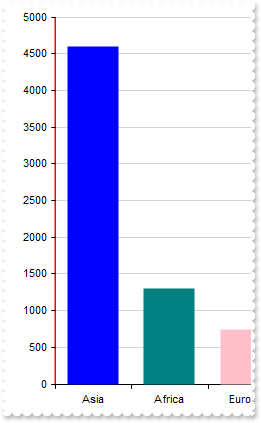
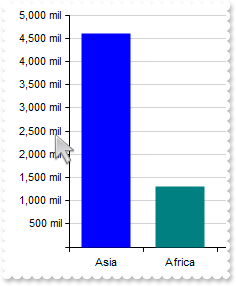
ReDefine the margins/limits of the value-axis
with thisform.Graph1
	.BeginUpdate
	.AutoFit = .T.
	with .ValueAxis
		.Min = -100
		.Max = 6000
	endwith
	.CategoryAxis.Categories = "Asia,Africa,Europe,North America,Antarctica,South America,Australia/Oceania"
	with .Series
		with .Add("4600,1300,747,579,0,422,42")
			.Name = "Population"
			.Misc(6) = 3
		endwith
	endwith
	.EndUpdate
endwith
|
|
141
|
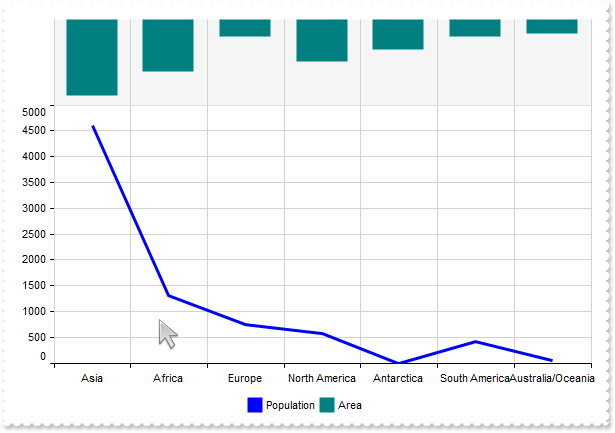
Define the start/end position of the value-axis (relative to full axis)
with thisform.Graph1
	.BeginUpdate
	.AutoFit = .T.
	with .ValueAxes
		.Add("p").End = 0.75
		with .Add("a")
			.End = 0.25
			.Visible = .F.
			.ColorChart = 16119285
			.Reverse = .T.
			.MajorGridLines.Width = 0
		endwith
	endwith
	with .CategoryAxis
		.Categories = "Asia,Africa,Europe,North America,Antarctica,South America,Australia/Oceania"
		.MajorGridLines.Color = "lightgray"
	endwith
	with .Series
		with .Add("4600,1300,747,579,0,422,42")
			.Name = "Population"
			.Axis = "p"
			.Type = "Line"
			.Misc(6) = 3
		endwith
		with .Add("4458,3037,1018,2470,1784,1018,856")
			.Name = "Area"
			.Axis = "a"
		endwith
	endwith
	.Legend.Visible = .T.
	.EndUpdate
endwith
|
|
140
|
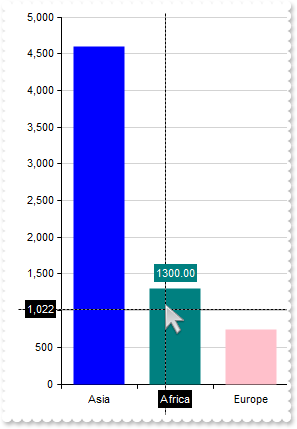
Customizes the tooltips to show on value-axis, when the crosshair hovers the chart
with thisform.Graph1
	.BeginUpdate
	.AutoFit = .T.
	with .ValueAxis
		.Format = "value format `0`"
		.CursorFormat = "value format `0`"
	endwith
	.CategoryAxis.Categories = "Asia,Africa,Europe,North America,Antarctica,South America,Australia/Oceania"
	with .Series
		with .Add("4600,1300,747,579,0,422,42")
			.Name = "Population"
			.Misc(6) = 3
		endwith
	endwith
	.Cursor.Visible = .T.
	.EndUpdate
endwith
|
|
139
|
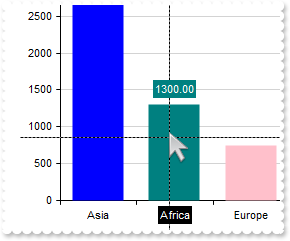
Hides the tooltip that's shown over the value-axis, while cursor hovers the serie
with thisform.Graph1
	.BeginUpdate
	.AutoFit = .T.
	.ValueAxis.CursorFormat = "``"
	.CategoryAxis.Categories = "Asia,Africa,Europe,North America,Antarctica,South America,Australia/Oceania"
	with .Series
		with .Add("4600,1300,747,579,0,422,42")
			.Name = "Population"
			.Misc(6) = 3
		endwith
	endwith
	.Cursor.Visible = .T.
	.EndUpdate
endwith
|
|
138
|
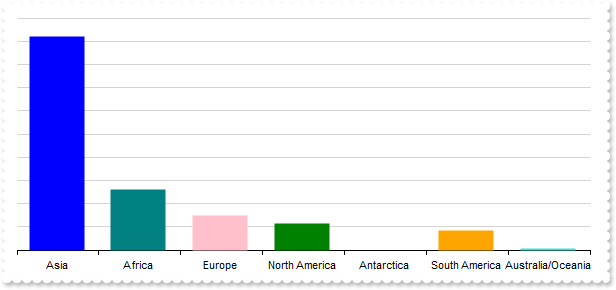
Shifts horizontally or vertically the labels relative to their original positions
with thisform.Graph1
	.BeginUpdate
	.AutoFit = .T.
	.ValueAxis.OffsetLabel = "4,8"
	.CategoryAxis.Categories = "Asia,Africa,Europe,North America,Antarctica,South America,Australia/Oceania"
	with .Series
		with .Add("4600,1300,747,579,0,422,42")
			.Name = "Population"
			.Misc(6) = 3
		endwith
	endwith
	.EndUpdate
endwith
|
|
137
|
Define the color to apply on the chart's background right to the value-axis
with thisform.Graph1
	.BeginUpdate
	.AutoFit = .T.
	.ValueAxis.ColorChart = "red"
	.CategoryAxis.Categories = "Asia,Africa,Europe,North America,Antarctica,South America,Australia/Oceania"
	with .Series
		with .Add("4600,1300,747,579,0,422,42")
			.Name = "Population"
			.Misc(6) = 3
		endwith
	endwith
	.EndUpdate
endwith
|
|
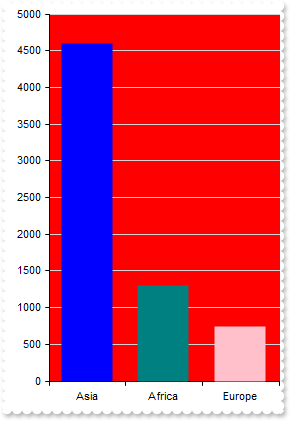
136
|
Changes the value-axis's background color
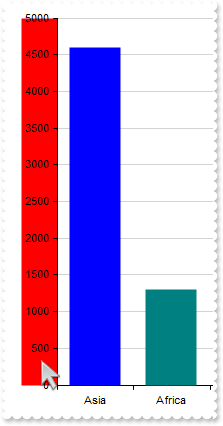
with thisform.Graph1
	.BeginUpdate
	.AutoFit = .T.
	.ValueAxis.Color = "red"
	.CategoryAxis.Categories = "Asia,Africa,Europe,North America,Antarctica,South America,Australia/Oceania"
	with .Series
		with .Add("4600,1300,747,579,0,422,42")
			.Name = "Population"
			.Misc(6) = 3
		endwith
	endwith
	.EndUpdate
endwith
|
|
135
|
Define the color, size, style, skip and step configuration options of the major grid-lines to be shown by the value-axis on the chart panel
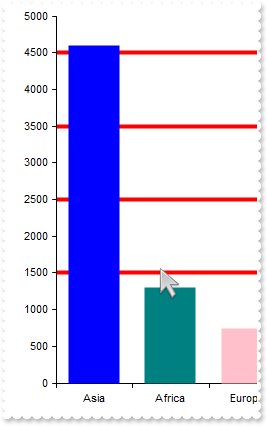
with thisform.Graph1
	.BeginUpdate
	.AutoFit = .T.
	with .ValueAxis.MajorGridLines
		.Color = "red"
		.Width = 4
		.Style = 0
		.Skip = 3
		.Step = 2
	endwith
	.CategoryAxis.Categories = "Asia,Africa,Europe,North America,Antarctica,South America,Australia/Oceania"
	with .Series
		with .Add("4600,1300,747,579,0,422,42")
			.Name = "Population"
			.Misc(6) = 3
		endwith
	endwith
	.EndUpdate
endwith
|
|
134
|
Define the color, size, style, skip and step configuration options of the major ticks to be shown on the value-axis
with thisform.Graph1
	.BeginUpdate
	.AutoFit = .T.
	with .ValueAxis.MajorTicks
		.Color = "red"
		.Width = 4
		.Style = 0
		.Skip = 3
		.Step = 2
	endwith
	.CategoryAxis.Categories = "Asia,Africa,Europe,North America,Antarctica,South America,Australia/Oceania"
	with .Series
		with .Add("4600,1300,747,579,0,422,42")
			.Name = "Population"
			.Misc(6) = 3
		endwith
	endwith
	.EndUpdate
endwith
|
|
133
|
Define the color, size and style to display the line of the value-axis
with thisform.Graph1
	.BeginUpdate
	.AutoFit = .T.
	with .ValueAxis.AxisLine
		.Color = "red"
		.Width = 2
		.Style = 0
	endwith
	.CategoryAxis.Categories = "Asia,Africa,Europe,North America,Antarctica,South America,Australia/Oceania"
	with .Series
		with .Add("4600,1300,747,579,0,422,42")
			.Name = "Population"
			.Misc(6) = 3
		endwith
	endwith
	.EndUpdate
endwith
|
|
132
|
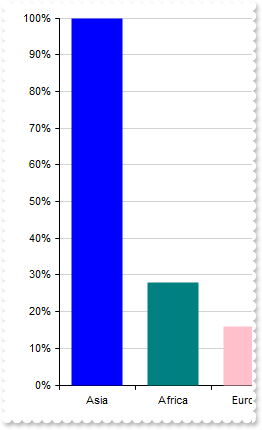
Converts the serie's values to [0,1] range, as percentages (the values area always numbers between 0 and 1)
with thisform.Graph1
	.BeginUpdate
	.AutoFit = .T.
	with .ValueAxis
		.AsPercent = .T.
		.Format = "value * 100 + `%`"
	endwith
	.CategoryAxis.Categories = "Asia,Africa,Europe,North America,Antarctica,South America,Australia/Oceania"
	with .Series
		with .Add("4600,1300,747,579,0,422,42")
			.Name = "Population"
			.Misc(6) = 3
		endwith
	endwith
	.EndUpdate
endwith
|
|
131
|
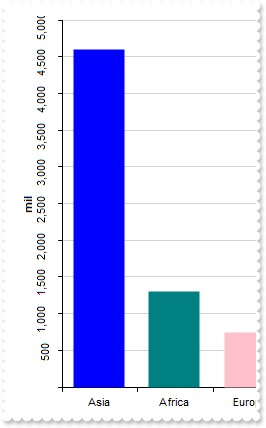
Define the rotation angle (in degrees) for the title and labels of the axis, in 'labels,title' format
with thisform.Graph1
	.BeginUpdate
	.AutoFit = .T.
	with .ValueAxis
		.Angle = "-90,-90"
		.Title = "<b>mil"
		.Format = "value ? value format `0` : ``"
	endwith
	.CategoryAxis.Categories = "Asia,Africa,Europe,North America,Antarctica,South America,Australia/Oceania"
	with .Series
		with .Add("4600,1300,747,579,0,422,42")
			.Name = "Population"
			.Misc(6) = 3
		endwith
	endwith
	.EndUpdate
endwith
|
|
130
|
Define the title of the value-axis
with thisform.Graph1
	.BeginUpdate
	.AutoFit = .T.
	.ValueAxis.Title = "<b>mil"
	.CategoryAxis.Categories = "Asia,Africa,Europe,North America,Antarctica,South America,Australia/Oceania"
	with .Series
		with .Add("4600,1300,747,579,0,422,42")
			.Name = "Population"
			.Misc(6) = 3
		endwith
	endwith
	.EndUpdate
endwith
|
|
129
|
Specifies the font attributes to apply on the title and labels of the value-axis
with thisform.Graph1
	.BeginUpdate
	.AutoFit = .T.
	.ValueAxis.Tfi = "<fgcolor red> Tahoma 10 bold"
	.CategoryAxis.Categories = "Asia,Africa,Europe,North America,Antarctica,South America,Australia/Oceania"
	with .Series
		with .Add("4600,1300,747,579,0,422,42")
			.Name = "Population"
			.Misc(6) = 3
		endwith
	endwith
	.EndUpdate
endwith
|
|
128
|
Define the direction of the value axis
with thisform.Graph1
	.BeginUpdate
	.AutoFit = .T.
	.ValueAxis.Reverse = .T.
	.CategoryAxis.Categories = "Asia,Africa,Europe,North America,Antarctica,South America,Australia/Oceania"
	with .Series
		with .Add("4600,1300,747,579,0,422,42")
			.Name = "Population"
			.Misc(6) = 3
		endwith
	endwith
	.EndUpdate
endwith
|
|
127
|
Aligns the value-axis to bottom/right or top/left side of the view
with thisform.Graph1
	.BeginUpdate
	.AutoFit = .T.
	.ValueAxis.Align = 2
	.CategoryAxis.Categories = "Asia,Africa,Europe,North America,Antarctica,South America,Australia/Oceania"
	with .Series
		with .Add("4600,1300,747,579,0,422,42")
			.Name = "Population"
			.Misc(6) = 3
		endwith
	endwith
	.EndUpdate
endwith
|
|
126
|
Customizes the labels of the value axis
with thisform.Graph1
	.BeginUpdate
	.AutoFit = .T.
	.ValueAxis.Format = "value ? `<c><b>` + (value format `0`) + `</b><br><c><fgcolor lightgray>mil` : ``"
	.CategoryAxis.Categories = "Asia,Africa,Europe,North America,Antarctica,South America,Australia/Oceania"
	with .Series
		with .Add("4600,1300,747,579,0,422,42")
			.Name = "Population"
			.Misc(6) = 3
		endwith
	endwith
	.EndUpdate
endwith
|
|
125
|
Customizes the labels of the value axis
with thisform.Graph1
	.BeginUpdate
	.AutoFit = .T.
	.ValueAxis.Format = "value ? (value format `0`) + ` mil` : ``"
	.CategoryAxis.Categories = "Asia,Africa,Europe,North America,Antarctica,South America,Australia/Oceania"
	with .Series
		with .Add("4600,1300,747,579,0,422,42")
			.Name = "Population"
			.Misc(6) = 3
		endwith
	endwith
	.EndUpdate
endwith
|
|
124
|
Hides the value-axis
with thisform.Graph1
	.BeginUpdate
	.AutoFit = .T.
	.ValueAxis.Visible = .F.
	.CategoryAxis.Categories = "Asia,Africa,Europe,North America,Antarctica,South America,Australia/Oceania"
	with .Series
		with .Add("4600,1300,747,579,0,422,42")
			.Name = "Population"
			.Misc(6) = 3
		endwith
	endwith
	.EndUpdate
endwith
|
|
123
|
Changes the position of value-axis (click to change the value-axis's position)
*** Click event - Occurs when the user presses and then releases the left mouse button over the control. ***
LPARAMETERS nop
	with thisform.Graph1
		.ValueAxes.Item("a").Position = 0
	endwith

with thisform.Graph1
	.BeginUpdate
	.AutoFit = .T.
	with .ValueAxes
		.Add("p")
		.Add("a").Color = "teal"
	endwith
	with .CategoryAxis
		.Categories = "Asia,Africa,Europe,North America,Antarctica,South America,Australia/Oceania"
		.MajorGridLines.Color = "lightgray"
	endwith
	with .Series
		with .Add("4600,1300,747,579,0,422,42")
			.Name = "Population"
			.Axis = "p"
			.Type = "Line"
			.Misc(6) = 3
		endwith
		with .Add("4458,3037,1018,2470,1784,1018,856")
			.Name = "Area"
			.Axis = "a"
		endwith
	endwith
	.Legend.Visible = .T.
	.EndUpdate
endwith
|
|
122
|
Access the value-axis giving its name (click to change the value-axis's background)
*** Click event - Occurs when the user presses and then releases the left mouse button over the control. ***
LPARAMETERS nop
	with thisform.Graph1
		.ValueAxes.Item("a").ColorChart = 16119285
		.Refresh
	endwith

with thisform.Graph1
	.BeginUpdate
	.AutoFit = .T.
	with .ValueAxes
		.Add("p").Start = 0.25
		with .Add("a")
			.End = 0.25
			.Visible = .F.
		endwith
	endwith
	with .CategoryAxis
		.Categories = "Asia,Africa,Europe,North America,Antarctica,South America,Australia/Oceania"
		.MajorGridLines.Color = "lightgray"
	endwith
	with .Series
		with .Add("4600,1300,747,579,0,422,42")
			.Name = "Population"
			.Axis = "p"
			.Type = "Line"
			.Misc(6) = 3
		endwith
		with .Add("4458,3037,1018,2470,1784,1018,856")
			.Name = "Area"
			.Axis = "a"
		endwith
	endwith
	.Legend.Visible = .T.
	.EndUpdate
endwith
|
|
121
|
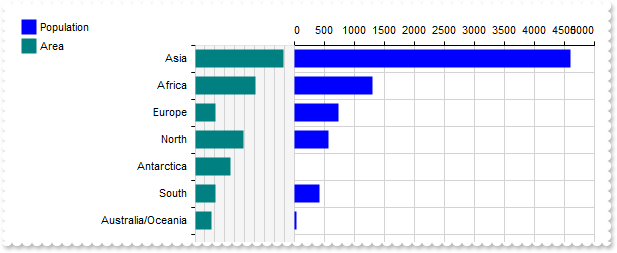
Specifies the name of the value axis to use
with thisform.Graph1
	.BeginUpdate
	.ValueSize = 18
	with .ValueAxes
		with .Add("pop-ax")
			.Name = "pop-ax"
			.Start = 0.25
			.Align = 0
		endwith
		with .Add("area-ax")
			.Name = "area-ax"
			.End = 0.25
			.Visible = .F.
			.ColorChart = 16119285
		endwith
	endwith
	with .CategoryAxis
		.Categories = "Asia,Africa,Europe,North America,Antarctica,South America,Australia/Oceania"
		.MajorGridLines.Color = "lightgray"
	endwith
	with .Series
		with .Add("4600,1300,747,579,0,422,42")
			.Name = "Population"
			.Axis = "pop-ax"
			.Misc(6) = 3
			.Vertical = .T.
		endwith
		with .Add("4458,3037,1018,2470,1784,1018,856")
			.Name = "Area"
			.Axis = "area-ax"
		endwith
	endwith
	with .Legend
		.Visible = .T.
		.Dock = 3
		.Align = 0
	endwith
	.EndUpdate
endwith
|
|
120
|
Remove a value-axis (click to remove the first value-axis)
*** Click event - Occurs when the user presses and then releases the left mouse button over the control. ***
LPARAMETERS nop
	with thisform.Graph1
		.ValueAxes.Remove(0)
	endwith

with thisform.Graph1
	.BeginUpdate
	.AutoFit = .T.
	with .ValueAxes
		.Add("p").Start = 0.25
		with .Add("a")
			.End = 0.25
			.Visible = .F.
			.ColorChart = 16119285
		endwith
	endwith
	with .CategoryAxis
		.Categories = "Asia,Africa,Europe,North America,Antarctica,South America,Australia/Oceania"
		.MajorGridLines.Color = "lightgray"
	endwith
	with .Series
		with .Add("4600,1300,747,579,0,422,42")
			.Name = "Population"
			.Axis = "p"
			.Type = "Line"
			.Misc(6) = 3
		endwith
		with .Add("4458,3037,1018,2470,1784,1018,856")
			.Name = "Area"
			.Axis = "a"
		endwith
	endwith
	.Legend.Visible = .T.
	.EndUpdate
endwith
|
|
119
|
Remove all value-axes (click to clear the value-axes)
*** Click event - Occurs when the user presses and then releases the left mouse button over the control. ***
LPARAMETERS nop
	with thisform.Graph1
		.ValueAxes.Clear
	endwith

with thisform.Graph1
	.BeginUpdate
	.AutoFit = .T.
	with .ValueAxes
		.Add("p").Start = 0.25
		with .Add("a")
			.End = 0.25
			.Visible = .F.
			.ColorChart = 16119285
		endwith
	endwith
	with .CategoryAxis
		.Categories = "Asia,Africa,Europe,North America,Antarctica,South America,Australia/Oceania"
		.MajorGridLines.Color = "lightgray"
	endwith
	with .Series
		with .Add("4600,1300,747,579,0,422,42")
			.Name = "Population"
			.Axis = "p"
			.Type = "Line"
			.Misc(6) = 3
		endwith
		with .Add("4458,3037,1018,2470,1784,1018,856")
			.Name = "Area"
			.Axis = "a"
		endwith
	endwith
	.Legend.Visible = .T.
	.EndUpdate
endwith
|
|
118
|
Adds multiple value-axes
with thisform.Graph1
	.BeginUpdate
	.AutoFit = .T.
	with .ValueAxes
		.Add("p").Start = 0.25
		with .Add("a")
			.End = 0.25
			.Visible = .F.
			.ColorChart = 16119285
		endwith
	endwith
	with .CategoryAxis
		.Categories = "Asia,Africa,Europe,North America,Antarctica,South America,Australia/Oceania"
		.MajorGridLines.Color = "lightgray"
	endwith
	with .Series
		with .Add("4600,1300,747,579,0,422,42")
			.Name = "Population"
			.Axis = "p"
			.Type = "Line"
			.Misc(6) = 3
		endwith
		with .Add("4458,3037,1018,2470,1784,1018,856")
			.Name = "Area"
			.Axis = "a"
		endwith
	endwith
	.Legend.Visible = .T.
	.EndUpdate
endwith
|
|
117
|
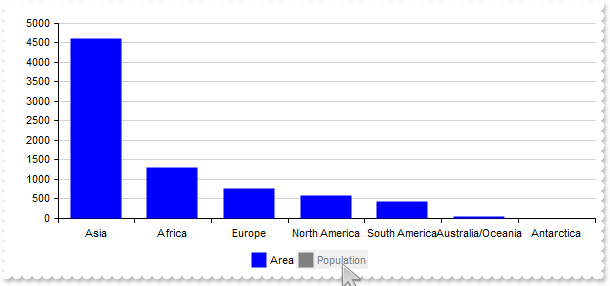
Define the foreground color to show the visible values within the control's legend
with thisform.Graph1
.BeginUpdate
.AutoFit = .T.
.Object.Background(208) = RGB(0,0,1)
.Object.Background(206) = RGB(0,0,1)
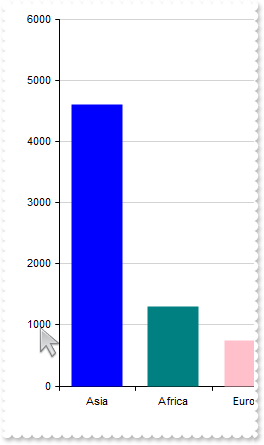
.Series.Add("Asia(4600), Africa(1300), Europe(747), North America(579), South America(431), Australia/Oceania(42)").Name = "Area"
with .Series.Add("Asia(4458), Africa(3037), North America(2470), South America(1784), Antarctica(1400), Europe(1018), Australia/Oceania(856)")
.Name = "Population"
.Visible = .F.
endwith
.Legend.Visible = .T.
.EndUpdate
endwith
|
|
116
|
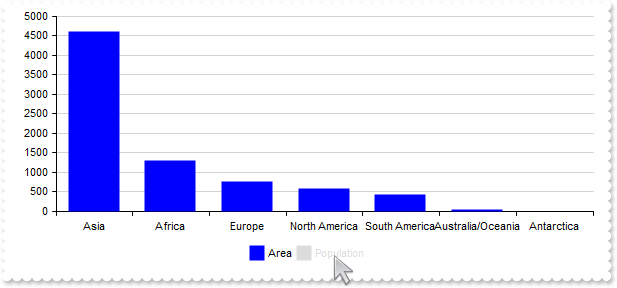
Defines a different background color to show the visible values within the control's legend

with thisform.Graph1
	.BeginUpdate
	.AutoFit = .T.
	.Object.Background(204) = RGB(240,240,240)
	.Series.Add("Asia(4600), Africa(1300), Europe(747), North America(579), South America(431), Australia/Oceania(42)").Name = "Area"
	with .Series.Add("Asia(4458), Africa(3037), North America(2470), South America(1784), Antarctica(1400), Europe(1018), Australia/Oceania(856)")
		.Name = "Population"
		.Visible = .F.
	endwith
	.Legend.Visible = .T.
	.EndUpdate
endwith
|
|
115
|
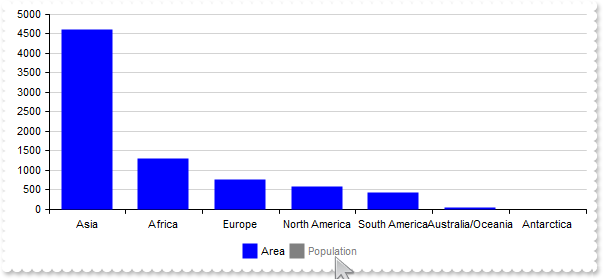
Defines a different background color to show the hidden values within the control's legend
with thisform.Graph1
	.BeginUpdate
	.AutoFit = .T.
	.Object.Background(205) = RGB(240,240,240)
	.Series.Add("Asia(4600), Africa(1300), Europe(747), North America(579), South America(431), Australia/Oceania(42)").Name = "Area"
	with .Series.Add("Asia(4458), Africa(3037), North America(2470), South America(1784), Antarctica(1400), Europe(1018), Australia/Oceania(856)")
		.Name = "Population"
		.Visible = .F.
	endwith
	.Legend.Visible = .T.
	.EndUpdate
endwith
|
|
114
|
Define the foreground color to show the hidden values within the control's legend
with thisform.Graph1
	.BeginUpdate
	.AutoFit = .T.
	.Object.Background(209) = RGB(220,220,220)
	.Object.Background(207) = RGB(220,220,220)
	.Series.Add("Asia(4600), Africa(1300), Europe(747), North America(579), South America(431), Australia/Oceania(42)").Name = "Area"
	with .Series.Add("Asia(4458), Africa(3037), North America(2470), South America(1784), Antarctica(1400), Europe(1018), Australia/Oceania(856)")
		.Name = "Population"
		.Visible = .F.
	endwith
	.Legend.Visible = .T.
	.EndUpdate
endwith
|
|
113
|
Hides a symbol or item of the legend by code
with thisform.Graph1
	.BeginUpdate
	.AutoFit = .T.
	.Series.Add("Asia(4600), Africa(1300), Europe(747), North America(579), South America(431), Australia/Oceania(42)").Name = "Area"
	with .Series.Add("Asia(4458), Africa(3037), North America(2470), South America(1784), Antarctica(1400), Europe(1018), Australia/Oceania(856)")
		.Name = "Population"
		.Visible = .F.
	endwith
	.Legend.Visible = .T.
	.EndUpdate
endwith
|
|
112
|
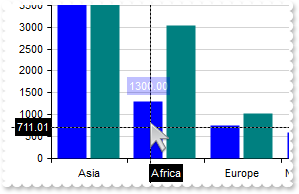
Define the percentage of transparency for displaying tooltips on series
with thisform.Graph1
	.BeginUpdate
	.Object.Background(211) = RGB(75,0,0)
	.AutoFit = .T.
	.Series.Add("Asia(4600), Africa(1300), Europe(747), North America(579), South America(431), Australia/Oceania(42)")
	.Series.Add("Asia(4458), Africa(3037), North America(2470), South America(1784), Antarctica(1400), Europe(1018), Australia/Oceania(856)")
	.Cursor.Visible = .T.
	.EndUpdate
endwith
|
|
111
|
Define the percentage of transparency for displaying tooltips on axes
with thisform.Graph1
	.BeginUpdate
	.Object.Background(210) = RGB(75,0,0)
	.AutoFit = .T.
	.Series.Add("Asia(4600), Africa(1300), Europe(747), North America(579), South America(431), Australia/Oceania(42)")
	.Series.Add("Asia(4458), Africa(3037), North America(2470), South America(1784), Antarctica(1400), Europe(1018), Australia/Oceania(856)")
	.Cursor.Visible = .T.
	.EndUpdate
endwith
|
|
110
|
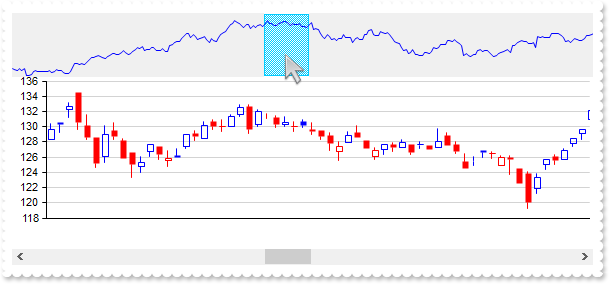
Specifies the percent of transparency to show the overview-selection (0 indicates opaque, 50% indicates semi-transparent, and 100% indicates fully transparent)
with thisform.Graph1
	.BeginUpdate
	.VisualAppearance.Add(1,"c:\exontrol\images\normal.ebn")
	.Object.Background(203) = RGB(75,0,0)
	.ValueSize = 6
	.Data = "C:\Program Files\Exontrol\ExGraph\Sample\Data/aapl.txt"
	with .Series.Add()
		.Name = "aapl"
		.Data = "AAPL (open),AAPL (high),AAPL (low),AAPL (close)"
		.Type = "candle"
	endwith
	.Overview.Visible = .T.
	.EndUpdate
endwith
|
|
109
|
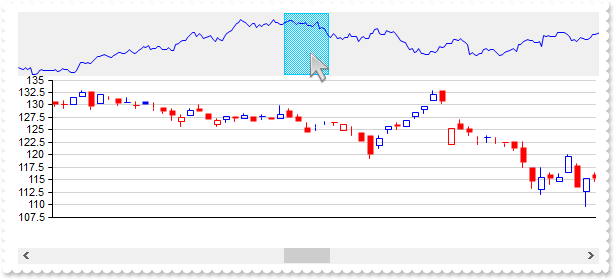
Changes the color to show the overview's selection (EBN color)
with thisform.Graph1
	.BeginUpdate
	.VisualAppearance.Add(1,"c:\exontrol\images\normal.ebn")
	.Object.Background(202) = 0x1000000
	.ValueSize = 6
	.Data = "C:\Program Files\Exontrol\ExGraph\Sample\Data/aapl.txt"
	with .Series.Add()
		.Name = "aapl"
		.Data = "AAPL (open),AAPL (high),AAPL (low),AAPL (close)"
		.Type = "candle"
	endwith
	.Overview.Visible = .T.
	.EndUpdate
endwith
|
|
108
|
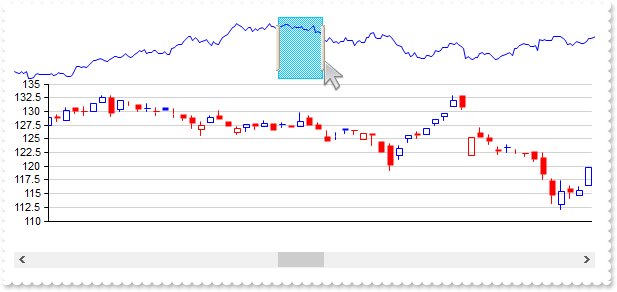
Changes the color to show the overview's selection (solid color)
with thisform.Graph1
	.BeginUpdate
	.Object.Background(202) = 0x10000ff
	.ValueSize = 6
	.Data = "C:\Program Files\Exontrol\ExGraph\Sample\Data/aapl.txt"
	with .Series.Add()
		.Name = "aapl"
		.Data = "AAPL (open),AAPL (high),AAPL (low),AAPL (close)"
		.Type = "candle"
	endwith
	.Overview.Visible = .T.
	.EndUpdate
endwith
|
|
107
|
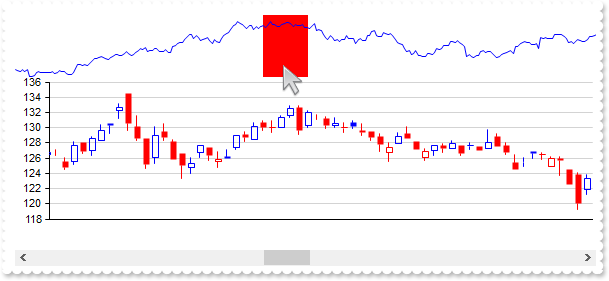
Changes the color to show the overview's selection
with thisform.Graph1
	.BeginUpdate
	.Object.Background(202) = RGB(255,0,0)
	.ValueSize = 6
	.Data = "C:\Program Files\Exontrol\ExGraph\Sample\Data/aapl.txt"
	with .Series.Add()
		.Name = "aapl"
		.Data = "AAPL (open),AAPL (high),AAPL (low),AAPL (close)"
		.Type = "candle"
	endwith
	.Overview.Visible = .T.
	.EndUpdate
endwith
|
|
106
|
Changes the overview's background
with thisform.Graph1
	.BeginUpdate
	.Object.Background(200) = RGB(240,240,240)
	.ValueSize = 6
	.Data = "C:\Program Files\Exontrol\ExGraph\Sample\Data/aapl.txt"
	with .Series.Add()
		.Name = "aapl"
		.Data = "AAPL (open),AAPL (high),AAPL (low),AAPL (close)"
		.Type = "candle"
	endwith
	.Overview.Visible = .T.
	.EndUpdate
endwith
|
|
105
|
Specifies the visual-appearance to display the left/right parts outside of the overview-selection
with thisform.Graph1
	.BeginUpdate
	.Object.Background(200) = RGB(240,240,240)
	.ValueSize = 6
	.Data = "C:\Program Files\Exontrol\ExGraph\Sample\Data/aapl.txt"
	with .Series.Add()
		.Name = "aapl"
		.Data = "AAPL (open),AAPL (high),AAPL (low),AAPL (close)"
		.Type = "candle"
	endwith
	.Overview.Visible = .T.
	.EndUpdate
endwith
|
|
104
|
Adds left/ resize-margins of the overview's selection to resize it (EBN)
with thisform.Graph1
	.BeginUpdate
	.VisualAppearance.Add(1,"c:\exontrol\images\normal.ebn")
	.Object.Background(199) = 0x1000000
	.ValueSize = 6
	.Data = "C:\Program Files\Exontrol\ExGraph\Sample\Data/aapl.txt"
	with .Series.Add()
		.Name = "aapl"
		.Data = "AAPL (open),AAPL (high),AAPL (low),AAPL (close)"
		.Type = "candle"
	endwith
	.Overview.Visible = .T.
	.EndUpdate
endwith
|
|
103
|
Adds left/ resize-margins of the overview's selection to resize it
with thisform.Graph1
	.BeginUpdate
	.Object.Background(199) = RGB(1,0,0)
	.ValueSize = 6
	.Data = "C:\Program Files\Exontrol\ExGraph\Sample\Data/aapl.txt"
	with .Series.Add()
		.Name = "aapl"
		.Data = "AAPL (open),AAPL (high),AAPL (low),AAPL (close)"
		.Type = "candle"
	endwith
	.Overview.Visible = .T.
	.EndUpdate
endwith
|
|
102
|
Changes the colors to show the value's tooltip
with thisform.Graph1
	.BeginUpdate
	.Object.Background(65) = RGB(1,0,0)
	.Object.Background(66) = RGB(255,255,255)
	.AutoFit = .T.
	.Series.Add("Pacific Ocean(16525), Atlantic Ocean(10646), Indian Ocean(7056), Southern Ocean(2033), Arctic Ocean(1406)").ShowValue = 1
	.EndUpdate
endwith
|
|
101
|
Changes the visual appearance of the borders of the tooltips
with thisform.Graph1
	.BeginUpdate
	.VisualAppearance.Add(1,"c:\exontrol\images\normal.ebn")
	.Object.Background(64) = 0x1000000
	.AutoFit = .T.
	.Series.Add("Pacific Ocean(16525), Atlantic Ocean(10646), Indian Ocean(7056), Southern Ocean(2033), Arctic Ocean(1406)").ShowValue = 1
	.EndUpdate
endwith
|